
Hurricane Response Checklist: 10 Data Layers Your GSOC Should Be Monitoring
 Cole McLain
A hurricane sets off cascading operational risk across infrastructure, personnel, and business continuity, and the forecast cone alone won't show you any of it. These are the 10 data layers a GSOC needs on a single map, from storm track through post-storm damage imagery, and the operational question each one answers.
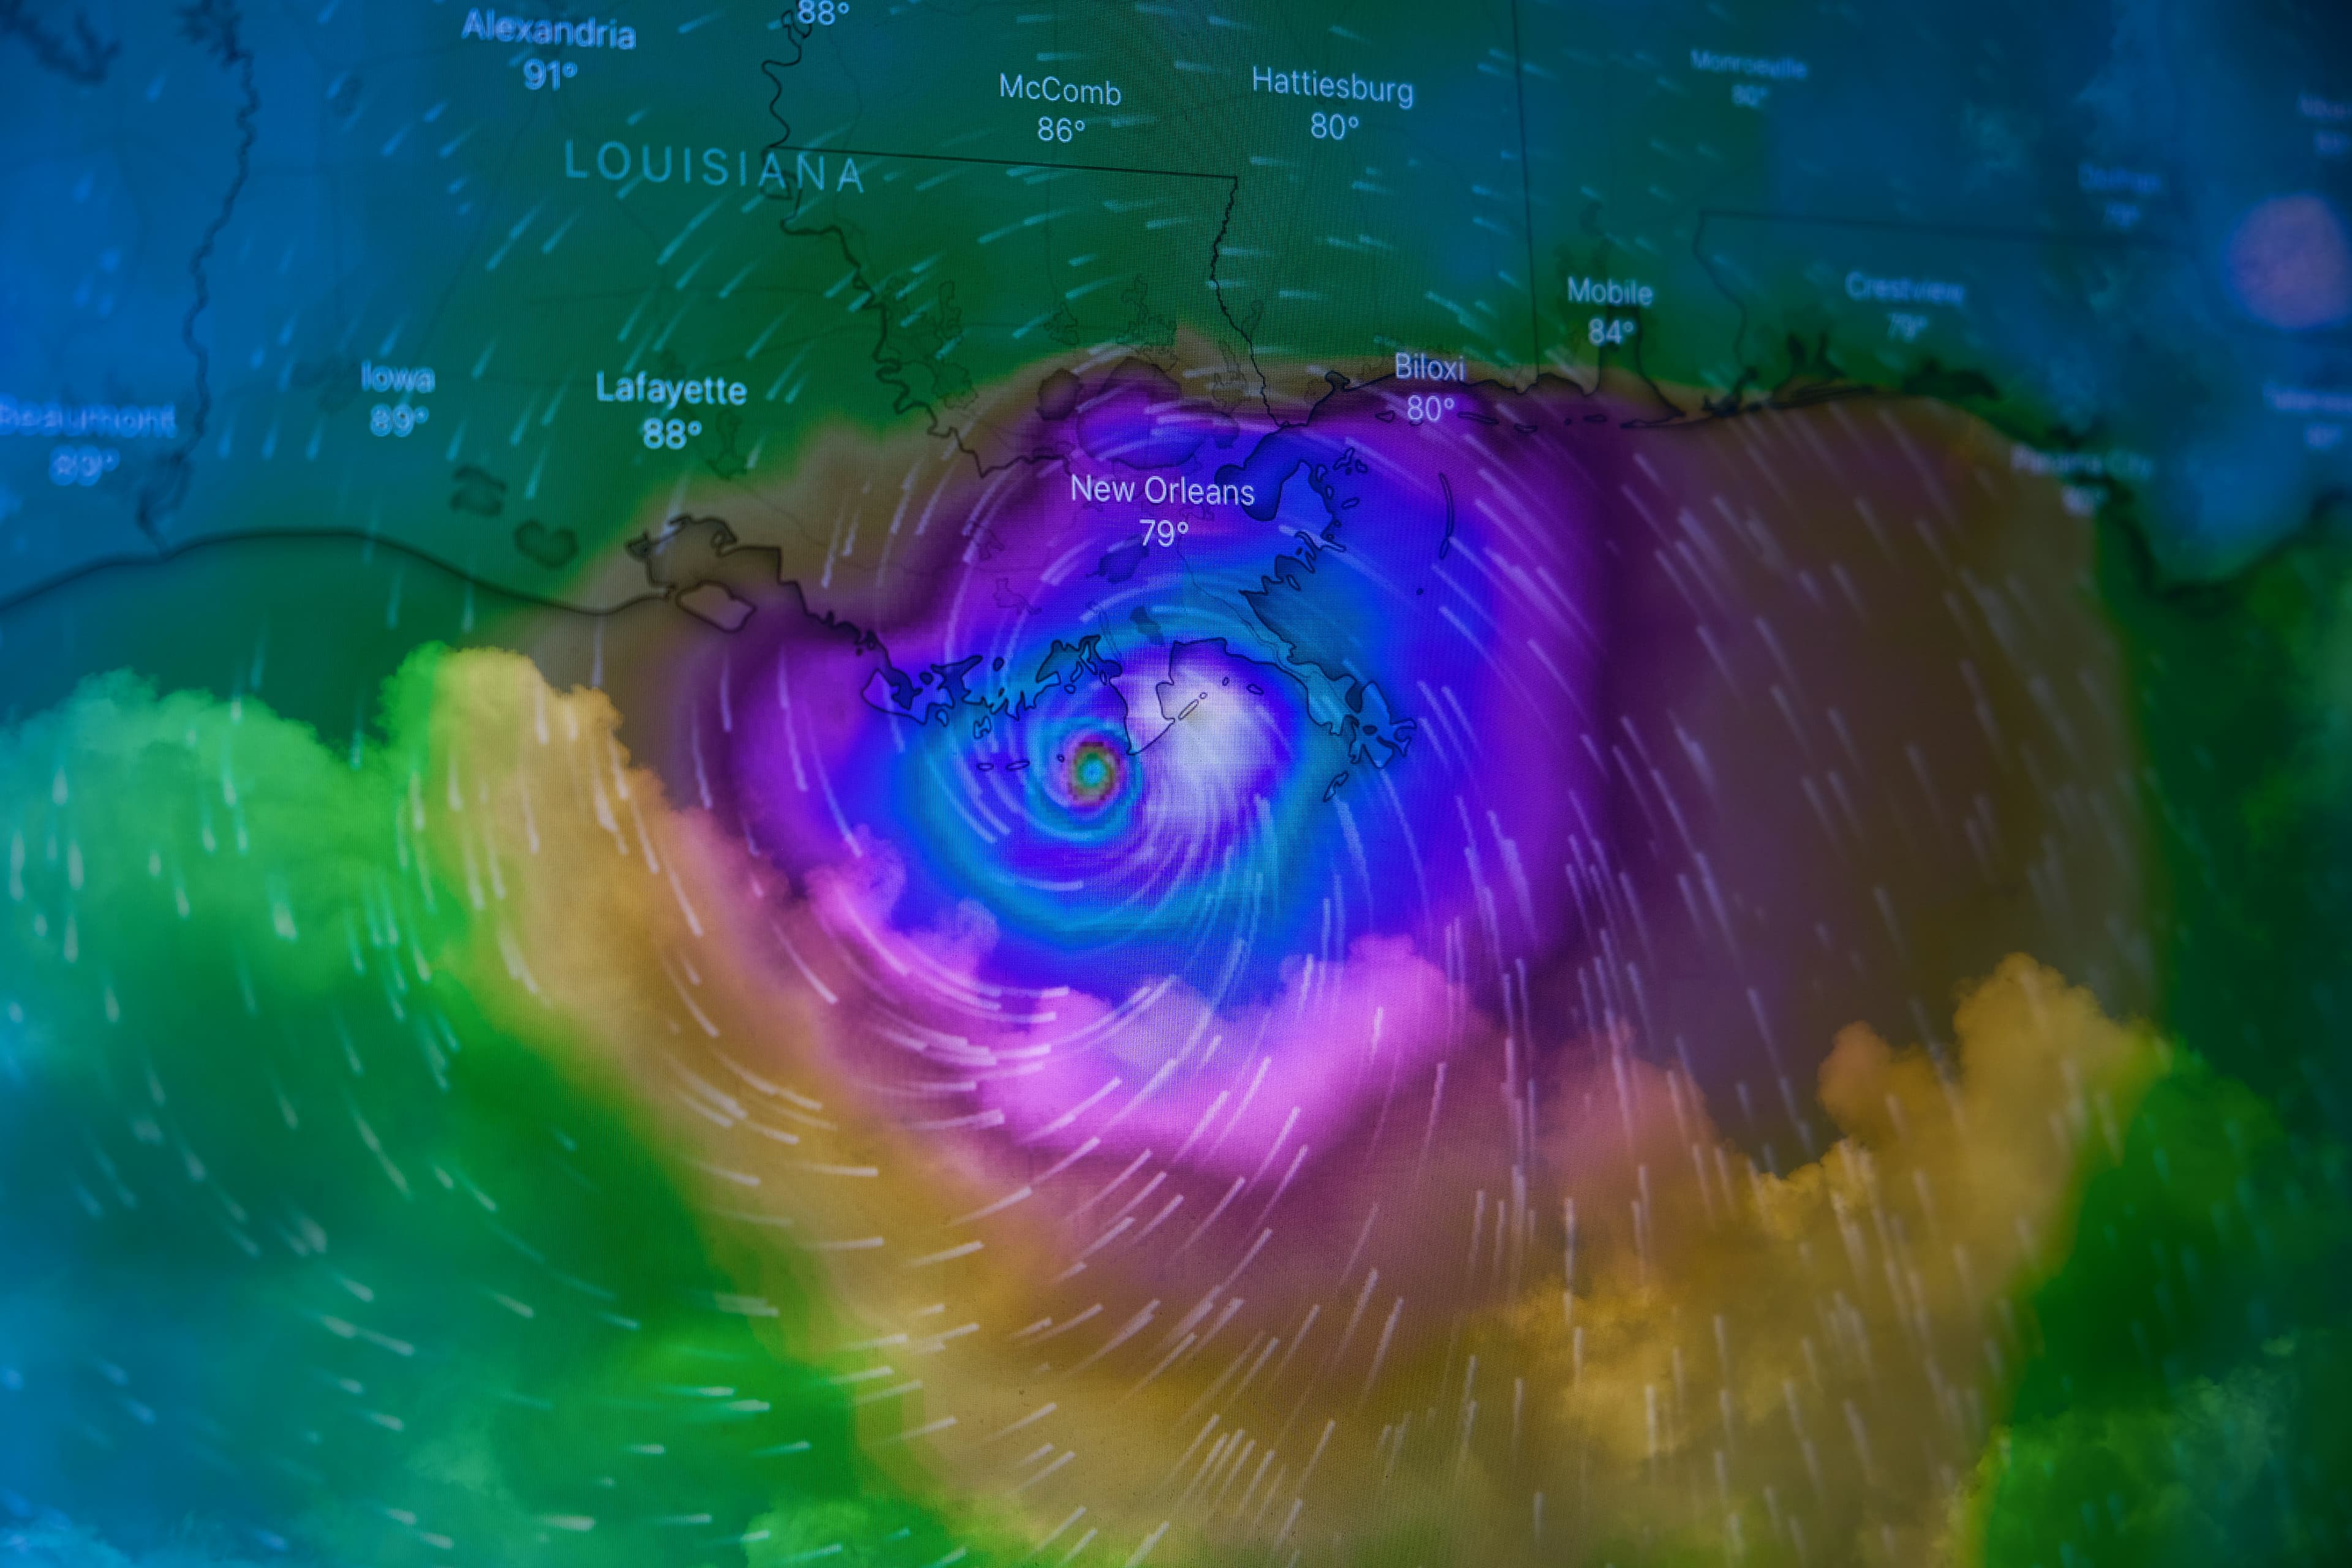
Most GSOCs track hurricanes by watching the forecast cone and checking news alerts. That covers the storm itself. It misses everything the storm sets in motion: flooded routes, grid failures, closed airports, stranded employees, and facilities you can't assess because nobody can reach them. A hurricane is a cascading set of operational risks that hit infrastructure, personnel, and business continuity at the same time.
This checklist covers the 10 data layers a GSOC should ingest into a unified geospatial platform before, during, and after landfall. Each layer answers a specific operational question. Together, they turn a storm track into an operational playbook.
Before Landfall
1. Storm track and cone of uncertainty. Plot the projected path and identify every facility, employee, and critical asset inside the cone. The National Hurricane Center updates its forecast every 6 hours, so your overlay needs to refresh on the same cycle. A common analytical mistake is treating the cone as the impact zone. The cone only shows where the center of the storm is likely to travel, and historically the center stays inside it about two thirds of the time. Wind, surge, and rain extend far beyond it, and tropical storm force winds can reach 200 miles from the center. An asset sitting just outside the cone is not clear, so score exposure by distance from the wind field, not by whether a site falls inside the graphic.
2. Radar imagery and rain forecasts. Live radar shows what the storm is actually doing: current intensity, rain band structure, and where the strongest wind is landing right now. Layer precipitation forecasts on top of it to identify flooding risk zones before the water arrives. This pairing matters because water, not wind, drives most hurricane deaths and much of the property damage, and rainfall totals depend heavily on the storm's forward speed. A fast-moving Category 3 can drop less rain than a stalled Category 1, which is how Harvey put 60 inches on parts of Texas in 2017. Radar tells you the reality, the forecast tells you the trajectory, and the gap between the two is where you adjust your response.
3. Flight data and airport status. Monitor cancellations, diversions, and airport operating status across the region. Airlines pull aircraft out of a threatened area well before landfall, and outbound seats vanish faster than most planning assumes. The practical deadline for getting travelers and non-essential personnel out is usually 48 to 72 hours before landfall, not the day the airport officially closes. Rising cancellation rates and diversion patterns are your leading indicator. When the last scheduled departures start filling, the decision window for commercial evacuation has already closed, and anyone still on the ground is riding out the storm or leaving by road.
4. National Weather Service warnings. Pull real-time storm surge, flash flood, and tornado warnings as structured data, not as text alerts someone reads and summarizes. These warnings are issued as polygons, which means you can overlay them directly against asset locations and trigger automated notifications when a facility or a traveler falls inside one. Surge warnings deserve particular weight because surge is the deadliest single hazard in a landfalling hurricane. Tornado warnings behave differently than people expect: they spin up in the outer rain bands, often hundreds of miles from the center and typically in the storm's front right quadrant, so facilities far from the track still need them monitored. These polygons define your evacuation triggers and shelter-in-place decisions.
During Landfall
5. Live traffic camera feeds. Cameras give you ground truth while conditions are too dangerous to send anyone out. They show which roads are flooded, which bridges are compromised, and where debris is blocking routes, in real time and without relying on secondhand reports. Treat the feeds analytically. A camera showing a dry road refutes a false flooding report just as usefully as a flooded one confirms a real one. And a camera that goes dark is a data point in itself, because it usually means power or communications have failed in that area. Cross-reference camera status against your outage layer and you start mapping infrastructure failure block by block.
6. River and stream gauge levels. Track water levels at key gauges upstream of your facilities. Riverine flooding lags the storm, sometimes by hours and sometimes by days, as rainfall drains through the watershed and crests move downstream. That lag is your lead time. A gauge rising fast 40 miles upstream tells you a low-lying facility floods tomorrow, which is enough time to move vehicles, shut down equipment, and relocate anything critical. USGS gauge data is free, updates continuously, and comes with flood stage thresholds already defined, so alerting against it is straightforward. This layer keeps working long after the wind story has ended, and inland flooding routinely damages sites that never saw hurricane force winds.
7. Power outage maps. Monitor utility outage feeds to watch the grid fail in real time. Outage clusters are a reliable proxy for wind damage severity, so this layer doubles as a damage map hours before any imagery is available. It drives three immediate decisions: where to deploy generators, which facilities to shut down cleanly rather than lose ungracefully, and which employees need safety checks because their area just lost power and probably cell coverage with it. Restoration estimates feed continuity planning, and they compound with everything else. A facility with power but no passable access road is still offline, which is why this layer only makes sense stacked with the others.
8. Evacuation routes and shelter status. These two feeds answer one question, which is how people move and where they end up, so ingest them together. Overlay official evacuation corridors from local emergency management, including contraflow activations, and track which public shelters are open, where they are, and whether they're at capacity. Both change during the event. A corridor that was open at noon can be cut by surge at 6 pm, and shelters open and fill in waves as conditions worsen. If employees can't get home, or can't get out, you need a current answer for where to send them, not the plan from yesterday's briefing. Checking routes against your camera and gauge layers before you recommend one closes the loop.
After the Storm
9. Damage assessment imagery. Ingest post-storm satellite and aerial imagery to assess facilities before anyone can physically reach them. NOAA typically publishes emergency response imagery within a day or two of landfall, and commercial satellite tasking can fill the gaps. Compare against pre-storm baselines to separate real damage from debris and standing water, and score each site: intact, damaged but operable, or destroyed. This layer sets your recovery timeline, tells you which sites need contractors versus cleanup crews, and starts your insurance documentation while the evidence is still fresh. Without it, your recovery plan is built on phone calls to people who may not be reachable.
10. Road closure data. Pull road status from state DOTs and local governments, and treat it as the gate on every recovery action. Damage assessments, generator deliveries, repair crews, and returning employees all depend on passable roads, so closures decide the sequencing of your entire re-entry plan. Watch for official re-entry restrictions too, because many coastal jurisdictions run credentialed checkpoints after a major storm and your response teams need documentation before they roll. Closure data lags reality in both directions, roads flood before the feed updates and reopen before it clears, so verify against your cameras and imagery before committing teams to a route.
The Point
Each layer answers a specific operational question. Who is exposed, how bad the storm actually is, when travel stops being possible, what triggers an evacuation, which routes still work, where the grid is failing, where people can go, what got destroyed, and when you can get back in.
Any one of them alone gives you a partial picture. Stack all 10 on a single map and the picture assembles itself in real time: warnings land on assets, outages line up with dark cameras, gauge crests point at tomorrow's flooded facility, and closures shape the re-entry plan. That's the difference between managing a hurricane and reacting to one.